
I sat in a portco board meeting last quarter where the Chief Revenue Officer presented a slide that I have now seen in some version every month for the last two years. The slide had three numbers on it. Target bookings for the quarter. Current pipeline coverage. The ratio between the two. The coverage number was 3.1x, just above the floor the company had set for itself. The room collectively exhaled.
Ninety days later, the company missed the plan by 34%. The pipeline had been there on the slide. The revenue was not. The CRO was let go. The operating partner asked me to walk him through what had broken, because the same pattern was showing up across three other companies in his portfolio. Same coverage ratios, same exhale moment, same eight-figure miss at quarter-end.
This piece is what I told him. The 3x coverage rule is not just outdated. It is mathematically broken in 2026, and the reason it keeps fooling boards is that the metric itself is a lagging composite of inputs that all moved in the wrong direction at the same time. The autonomous agent conversation that has eaten the GTM category for the last eighteen months is not really about productivity. It is about whether the input to the coverage equation can be rebuilt at all. I want to walk through why coverage is collapsing, what stops working when you try to fix it the old way, and what the actual repair looks like for the operating partners and CFOs reading this.
See the agent system run live against this exact problem: Tech Week Boston autonomous agents pipeline demo.
The math that broke

The coverage rule was always just one equation. Required pipeline equals quota divided by win rate. If your win rate is 33%, you need 3x coverage. If your win rate is 25%, you need 4x. If your win rate is 20%, you need 5x. The formula has not changed. The win rate has.
The most rigorous independent benchmark on this is the Ebsta x Pavilion 2025 GTM Benchmarks, which analyzed 655,000 opportunities across $48 billion in pipeline. Median B2B win rates dropped from 29% in 2024 to 19% in 2025. At 19%, the implied required coverage is 5.3x. The companies still operating on the 3x rule of thumb are running their forecast against a win rate that no longer exists in the dataset.
When Marc Benioff said on a Salesforce earnings call that the company now needs 50% more pipeline than two years ago to hit the same number, he was not flagging a Salesforce-specific problem. He was naming what every revenue leader has been quietly absorbing. The pipeline you need has gotten bigger because the conversion you can count on has gotten smaller. Carilu Dietrich, the former CMO at Atlassian, put it most cleanly in her newsletter: where 3x may have been standard, 5x is now required to hit revenue.
Meanwhile, the actual coverage companies are running is going the other direction. ICONIQ’s State of Go-to-Market 2025 report, which covers their portfolio plus 200 GTM executives, shows median coverage slipped from 3.9x to 3.6x year over year, while CFOs raised target coverage to 4.1x. The gap between what teams are asked to produce and what they actually have on the board has opened up underneath everyone, and most operators have not adjusted the rule of thumb to match.
Coverage is the score, not the input. The 3x rule was always just a shorthand for a win rate that no longer holds.
Why nobody notices in time
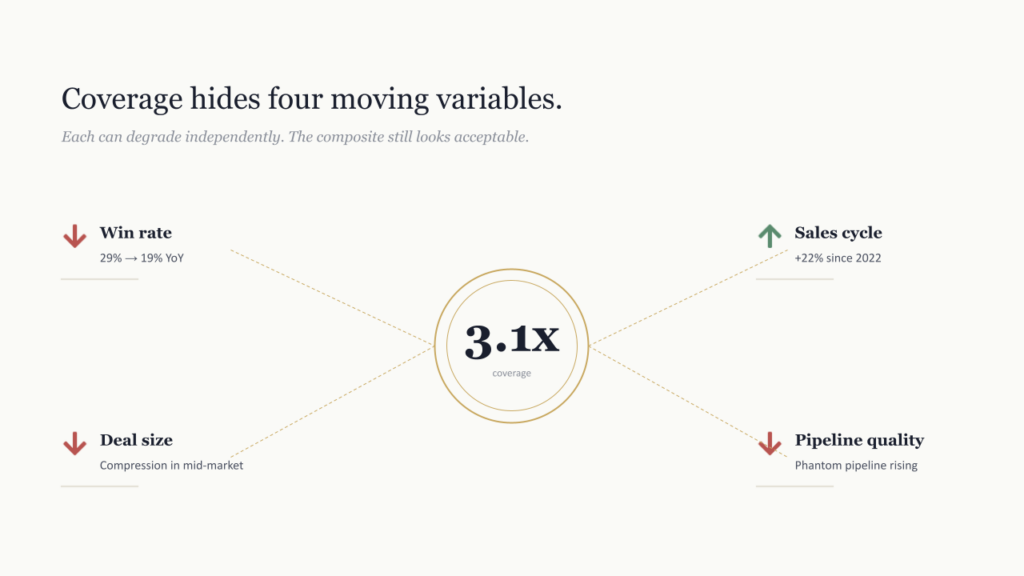
Here is the part that fooled the board I described at the top. Pipeline coverage is a single number that hides four underlying movements. Win rates, sales cycle length, average deal size, and pipeline quality. Each of those can degrade independently, and the composite ratio can still look acceptable until two or three of them are bad enough at the same time that the quarter falls apart.
What our CRO showed the board was a nominal number. 3.1x coverage. What he did not show was the weighted version. Late-stage deals discounted by their actual probability of closing in the quarter, which is what the forecast really depends on. Dave Kellogg has been writing about this gap for over a decade on Kellblog and now calls the current environment a pipeline crisis rather than a conversion rate crisis. His framing is exactly right. Companies are not converting worse on the pipeline they have. They are working with pipeline that was never as real as the slide claimed.
The reason this keeps happening is structural. The board reviews the metric once a quarter. The metric is a single number. Reps have an incentive to inflate stage-progression. Sales operations rolls everything up into the same field on the same dashboard. Nobody on the call is asking what the win rate is going to be in three weeks because that question has no easy answer. So the 3x number gets presented, the room exhales, and the next forty-five days of work proceeds on an assumption that was already wrong.
When we run a Strategic Growth Diagnostic with a PE-backed portfolio company, the first thing we look at is not coverage. It is the four underlying inputs and how they have moved over the last six quarters. Eight times out of ten, the coverage number is hiding a directional collapse in one of them that the board has not seen because the composite kept looking acceptable.
Why this is a capital efficiency problem, not a sales problem
If you are an operating partner or a CFO reading this, the part of the coverage collapse that should actually concern you is what it does to the rest of the financial picture. Coverage is not a sales metric on a standalone basis. It is the first link in a chain that ends at your valuation multiple.
The chain goes like this. When coverage understates the pipeline needed, the team misses bookings. When the team misses bookings, the same sales and marketing spend now produces a smaller numerator over a flat denominator, so the CAC ratio gets worse. Benchmarkit’s 2025 SaaS Performance Metrics Report, which covers more than 1,800 companies, shows median CAC payback extended from 14 months to 18 months in a single year. For companies above $100K average contract value, the median is now 24 months. That number is the leading indicator most institutional buyers underwrite to.
When CAC payback extends, Rule of 40 attainment drops. When Rule of 40 drops, the valuation multiple compresses. The companies that score above 40 on the rule continue to command a 121% premium in PE secondary markets. The companies that drop below it get repriced on the next round, the next sale, or the next quarterly mark. This is the chain operating partners are actually watching when they ask about coverage, even if the question they ask out loud is about pipeline volume.
Insight Partners’ Insight Onsite operating arm surveyed more than 100 of their portfolio companies on this exact problem last year. Their finding was sharp. In nearly half of the portfolio, marketing is now evaluated on total company pipeline, not on MQLs. The shift reflects what operators have learned the hard way. The intermediate metrics that used to give comfort have stopped predicting the revenue outcomes, and the only thing that actually correlates anymore is the discipline of what enters the pipeline in the first place. Defining the right ICP has become a board-level concern, not a marketing operations concern, for exactly this reason.
Why the old fixes do not work anymore
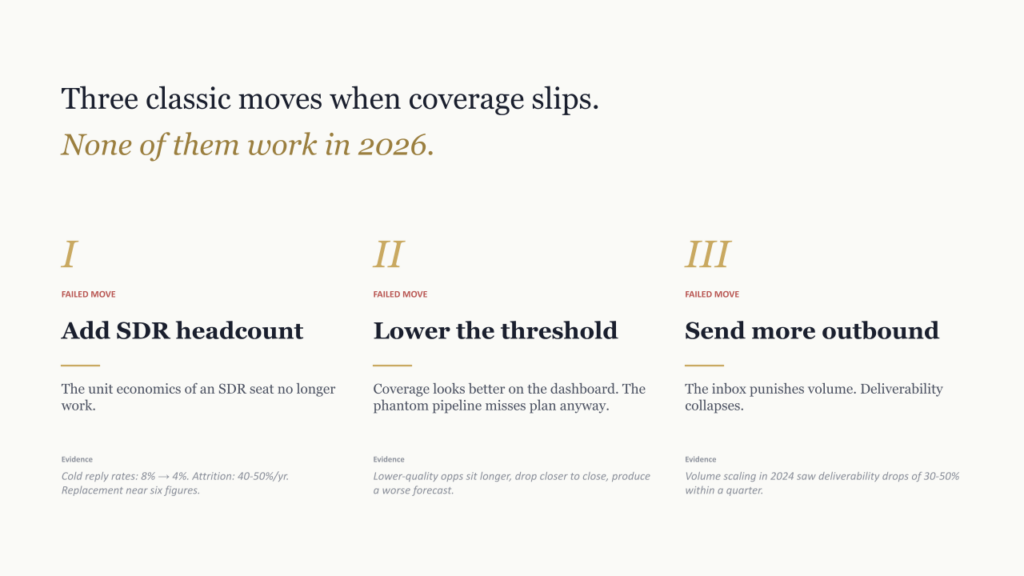
Every operator I talk to has tried some version of the same three fixes when coverage starts slipping. None of them are scaling in 2026, and the math behind why is worth understanding before you spend another quarter trying them.
Adding SDR headcount. The classic move when coverage drops is to hire more people to generate more meetings. The structural problem is that the unit economics of an SDR seat no longer work. We have written about this in detail in the broken SDR cost model breakdown, but the short version is that cold reply rates have fallen from above 8% to below 4% over the last several years, attrition runs 40 to 50% annually, and the all-in cost to replace a single departed SDR now sits near six figures once you include the vacant seat, the ramp loss, and the recruiting overhead. Adding more of this to fix a coverage gap is putting more capital into a system whose conversion is what created the gap.
Lowering the qualification threshold. Another common move is to relax what counts as pipeline. More leads cross the SAL or SQL line, the coverage ratio recovers on the dashboard, and the board exhales again. What happens next is predictable. The lower-quality opportunities sit in the funnel longer, drop out closer to the close date, and produce exactly the kind of phantom pipeline that misses plan despite hitting coverage. Operators learn this lesson exactly once before they stop using ratio inflation as a coverage tool.
Sending more outbound volume. The third move is to scale outreach itself. More emails, more sequences, more cadences. This was the operating logic behind the entire first wave of AI SDR tools. The structural problem is the inbox. Gartner has documented that 73% of B2B buyers now actively avoid suppliers sending irrelevant outreach, and the email providers have made the spam threshold a structural constraint, not a guideline. Companies that scaled volume aggressively in 2024 saw deliverability drop by 30 to 50% within a quarter of the Google and Yahoo enforcement changes. More volume into a system that punishes volume produces less reachable pipeline, not more.
All three fixes share the same structural error. They treat coverage as an output that can be increased by working the funnel harder, when the actual problem lives upstream of the funnel entirely.
The fix is upstream, not downstream
The companies that have rebuilt coverage in 2026 did not do it by adding more SDRs or sending more outbound. They did it by changing what enters the funnel before any of those motions run. The technical name for this is signal-based GTM. The practical name is figuring out which 5% of your TAM is actually buying right now and sending energy only to that 5%.
The Ehrenberg-Bass Institute’s 95-to-5 framework is the most cited academic foundation for this approach. The research is straightforward. At any given moment, roughly 5% of the buyers in any B2B category are in-market. The other 95% are not, will not respond to outreach in this quarter regardless of how clever the sequence is, and absorb energy that produces nothing. The traditional SDR model could not separate the 5% from the 95% at scale. The agent infrastructure described in the autonomous GTM playbook can.
What that looks like operationally is a layered system. The signal infrastructure watches the entire addressable universe for changes that correlate with buying intent. Trigger events. Hiring patterns. Technology shifts. Content engagement. Job changes in known buying roles. Tools like 6sense, Common Room, and UserGems each handle different layers of the signal stack. The agent layer reasons over the signals, ranks the accounts that crossed a threshold, enriches them, and hands them to the sales team or to an outreach motion with the context that makes the touch worth making.
The economics of this are different from the economics of adding SDRs. Common Room’s published case study with Semgrep documented a 74% increase in qualified pipeline in a single quarter from signal-based outbound, with a 2.5x payback inside the same quarter. Salesforce’s own internal Agentforce deployment, which they call Customer Zero, surfaced $1.7 million in pipeline from dormant leads in the first year of operation, working accounts a human team would never have gotten to. These are not vendor claims about agent productivity. They are operator-reported pipeline lifts from rebuilding the input layer.
If you are evaluating where to deploy the agent infrastructure inside your organization, the build versus partner decision becomes the next operational question. The signal stack and the agent orchestration are not turnkey products you flip on. They require the structured ICP work, the data layer, and the operating discipline that most teams cannot stand up alone within a quarter.
Where the autonomous agent argument breaks down
I want to be precise here, because the autonomous agent conversation has produced more vendor noise than almost any GTM topic in the last two years, and operators are right to be skeptical. The fix I have described is signal-driven agent infrastructure. It is not the same as the AI SDR pitch that dominated 2024 and most of 2025.
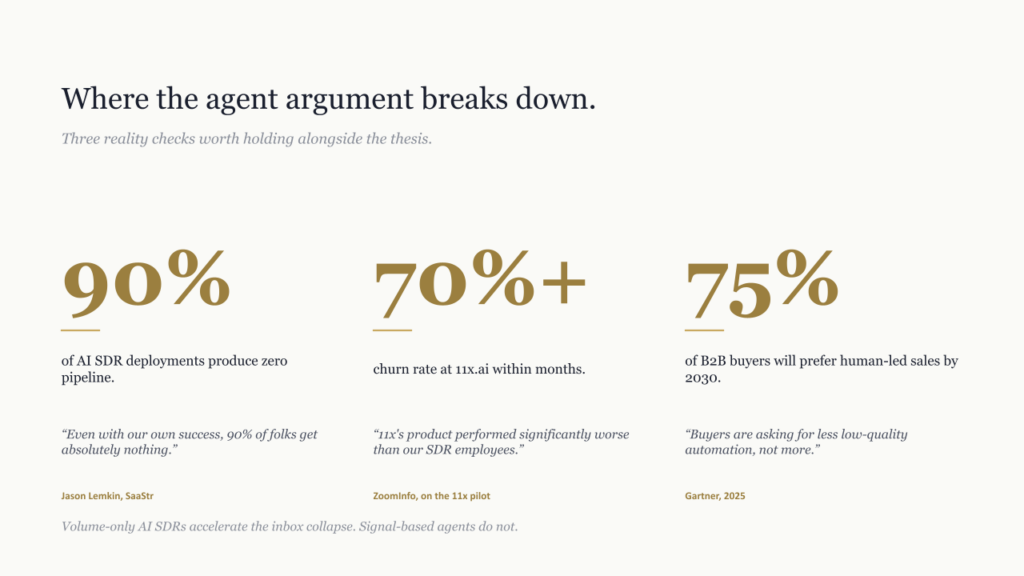
The AI SDR category, as marketed, was largely a productivity claim. Replace your human SDR team with an agent that sends more emails, faster, at lower cost. The category produced one of the most public failures of the cycle. TechCrunch documented in March 2025 that 11x.ai, the most-funded company in the segment, had been claiming customers it did not have. ZoomInfo, named in the marketing, publicly stated that during the pilot 11x’s product performed significantly worse than their human SDR team. The reported customer churn ran above 70% within months. The category had a credibility problem the entire space inherited.
Jason Lemkin at SaaStr ran an honest postmortem on what he had watched across more than twenty B2B SaaS deployments and concluded that 90% of AI SDR deployments produced zero pipeline. Not less pipeline. Zero. His diagnosis was that the tools required real operational ownership to work, and operators kept treating them as fire-and-forget productivity software. The companies that got results, including Lemkin’s own at SaaStr, treated the agent layer as infrastructure that required as much human management as a junior team. We have written separately about why the AI SDR category and the autonomous agent category are not the same thing, and the difference matters here.
Gartner’s longer-range view also deserves a hearing. Their research projects that by 2030, 75% of B2B buyers will actively prefer sales experiences that prioritize human interaction over AI. The buyer is not asking for more automation in the outreach layer. They are asking for less low-quality automation, and there is no point pretending otherwise. The signal-based agent thesis I have described works because it reduces the volume of irrelevant outreach and increases the relevance of what does go out. Pure volume agents do the opposite.
The honest version of the argument is narrower than the vendor pitch. Autonomous agents fix the coverage gap when they are deployed against the input problem. They make it worse when they are deployed against the volume problem.
What the new coverage architecture actually looks like
If you are an operating partner running diligence on a portco’s pipeline next quarter, or a CFO trying to figure out whether the 3x number on your dashboard means anything anymore, here is what I would look for instead. Not as a checklist, but as the rough shape of what coverage means in companies that are actually hitting plan in 2026.
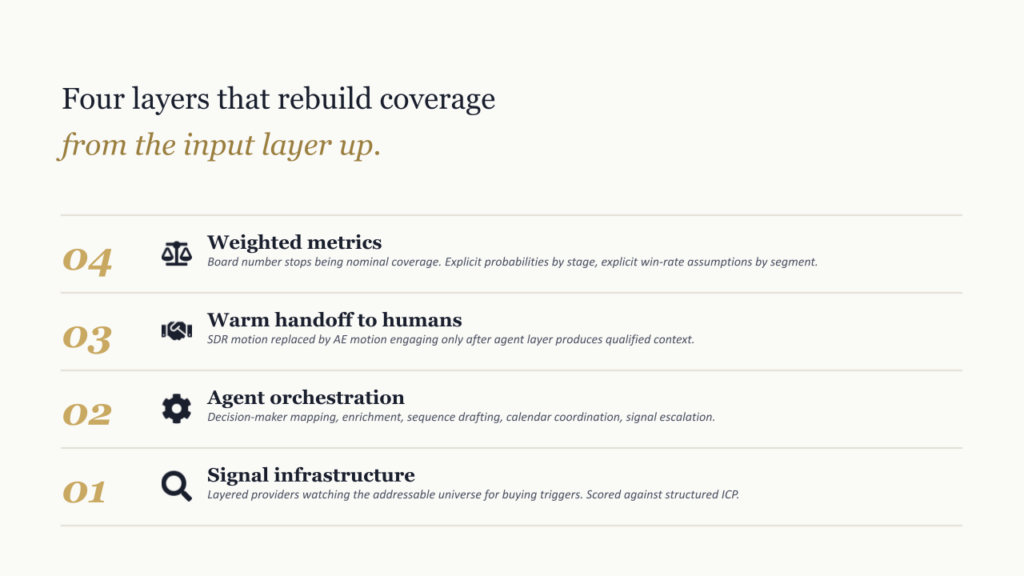
The first layer is signal infrastructure. Not a single tool. A set of layered providers that watch the addressable universe for the buying triggers that correlate with closed-won at this specific company. The signals get scored against the structured ICP and produce a ranked, continuously refreshed account list, not a static target list updated quarterly.
The second layer is agent orchestration. Decision maker mapping, contact enrichment, sequence drafting, calendar coordination, and signal escalation, all running against the ranked list from layer one. Tools like Clay, Apollo, and Outreach each handle a slice of this layer. The orchestration is what turns the signal into actual motion.
The third layer is human handoff at the warm threshold, not at cold prospecting. The SDR motion gets replaced by an account executive motion that engages prospects after the agent layer has produced a qualified context. The human capacity gets reallocated to the conversations that actually need a person, which is what the Gartner research on buyer preference predicted would matter by the end of the decade.
The fourth layer is the metric itself. The board number stops being nominal coverage and starts being weighted coverage, with explicit probabilities by stage and explicit assumptions about win rate by segment. The CFO knows the assumptions. The operating partner knows the assumptions. The metric is a forecast input, not a comfort signal. This is the shift that closes the loop between coverage and actual revenue, and it is the one that lets the rest of the architecture do its work without the board being fooled by a number that has not been honest in three years.
The companies that have rebuilt all four layers in 2026 are hitting plan more consistently than the companies that ran the old 3x playbook with marginal improvements. The companies that bolted an AI SDR onto the broken architecture are roughly where they were before, with a new vendor invoice. The companies that did neither are the ones generating the kind of quarterly miss that I started this piece with.
About Azarian Growth Agency
Azarian Growth Agency is an AI native growth marketing agency working with VC-backed founders, PE operating partners, and growth-stage B2B leadership teams. We build full funnel growth systems anchored on agent infrastructure, with 91 agents in production across client engagements as of 2026.
Our work spans pipeline diagnostics, ICP architecture, decision maker mapping, intent signal infrastructure, outreach agent design, and the broader stack of AI content marketing, AI driven customer insights, and generative AI for marketing. The Strategic Growth Diagnostic is the entry point for most engagements: a structured assessment of pipeline, CAC, signal infrastructure, and agent readiness, framed against the metrics PE and VC institutional buyers actually use.
I will run a recurring live demo of the autonomous agent system the agency builds for B2B clients. The session walks through the full agent handoff in real time, with particular focus on how the signal layer and agent orchestration rebuild pipeline coverage in companies missing a plan under the old 3x rule. Attendees see the prompts, the data flows, the verification checkpoints, and the metrics framework that ties the motion back to pipeline, CAC payback, and Rule of 40. The session is built for VC-backed founders, VPs of Sales, and operating partners evaluating GTM efficiency at the portfolio level.
Watch the live demo: Tech Week Boston autonomous agents pipeline session.

