

Revenue growth now drives more than half of total value creation in PE exits. That number has risen materially over the past decade as financial engineering has become less differentiated and operational improvement has become the primary battleground for returns.
According to Gain.pro research on PE value creation, revenue growth accounted for 71% of exit value creation in 2024, up from 64% the prior year. The implication for every Operating Partner managing a portfolio company with an exit horizon of 12 to 24 months is direct: if revenue growth is the primary driver, and marketing is the infrastructure that makes revenue growth sustainable and repeatable, then marketing readiness is a valuation question, not a function question.
Most portfolio companies are not ready. EY’s exit readiness research found that 65% of PE firms struggle to fully capture value creation in exit EBITDA. A significant part of that gap is marketing infrastructure that was never built to produce the metrics sophisticated buyers examine during commercial due diligence.
The 24 months before exit are the window in which that gap can still be closed. After that, the data does not exist, the trends cannot be established, and the narrative cannot be credibly told.
This article covers what sophisticated buyers examine in marketing during due diligence, how each marketing metric connects to EBITDA and exit valuation, the four phases of a pre-exit marketing value creation plan, and what an Operating Partner can do in the next 90 days to begin closing the gap.
Why Marketing Is Now a Valuation Question
The shift from financial engineering to operational value creation has been building for over a decade. Bain’s 2026 Global Private Equity Report notes that nearly 40% of all PE portfolio companies are now held for more than five years, up from 29% in 2019. Median hold periods reached 5.9 to 6.7 years in 2025. At those timelines, the value creation thesis must be operational, not transactional.
Companies cannot rely on multiple expansions or cheap debt to generate returns. They must grow revenue, improve unit economics, and demonstrate scalable demand generation to command premium multiples at exit.
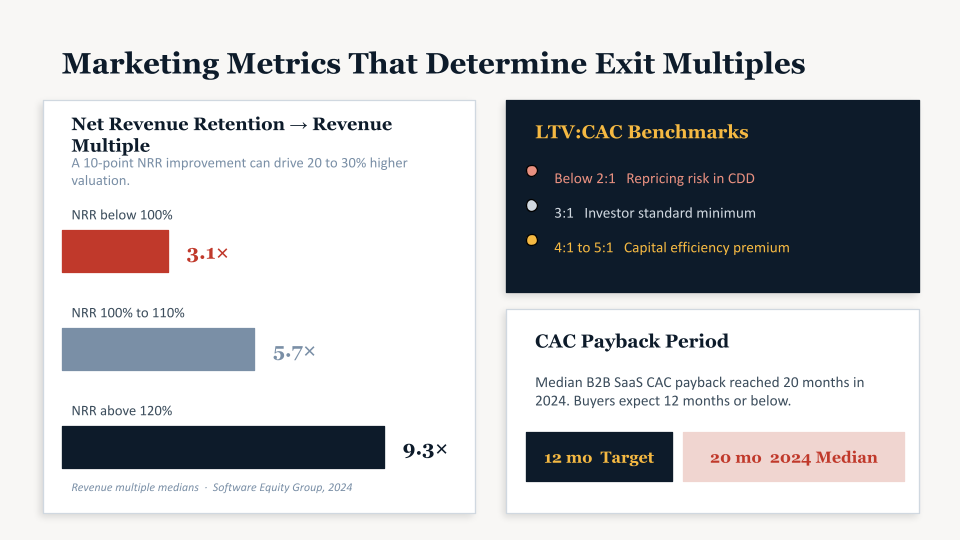
The valuation premium for getting this right is measurable. Companies with net revenue retention above 120% trade at revenue multiples of 9.3x, compared to 3.1x for companies with NRR below 100%. That is a three-times valuation difference attributable substantially to the quality of customer relationships and the marketing and success infrastructure that maintains them.
The mechanism is straightforward. At a 10x EBITDA multiple, every dollar of incremental EBITDA from marketing efficiency produces ten dollars of enterprise value at exit.
A portfolio company spending $5 million on marketing that reduces its customer acquisition cost by 30% through channel optimization and attribution improvements generates approximately $1.6 million in annual cost savings. At a 10x multiple, that is $16 million in additional enterprise value from a 90-day infrastructure project.
The problem is that most portfolio companies have not connected these numbers. Marketing is reported to boards in impressions, click-through rates, and engagement metrics that appear nowhere in a purchase price calculation. The work required to close this gap is specific, sequenced, and takes longer than most Operating Partners expect.
What Buyers Examine During Marketing Due Diligence
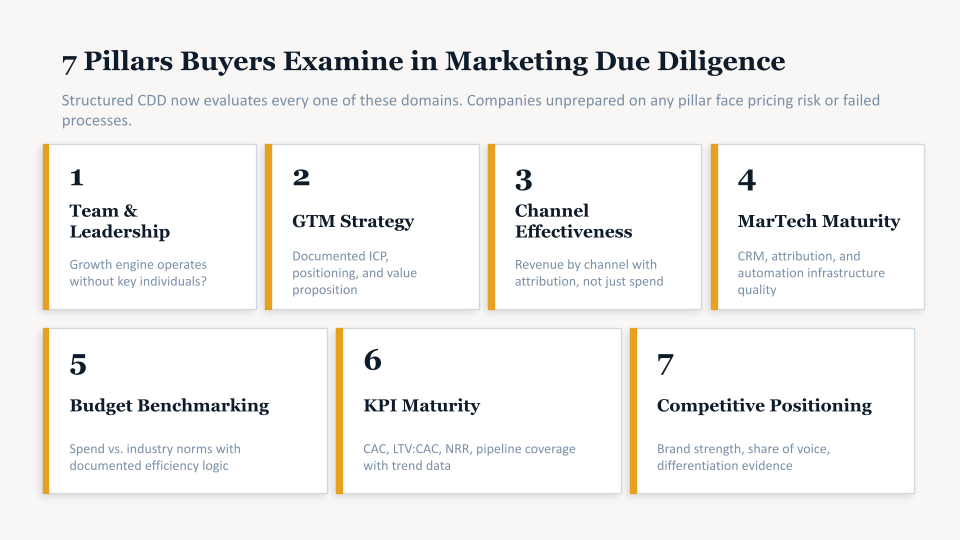
Commercial due diligence has become significantly more rigorous in the past five years. According to Magnus Consulting, experienced buyers now conduct structured marketing due diligence covering seven pillars: team and leadership depth, GTM strategy clarity, channel effectiveness and diversification, marketing technology maturity, budget and spend benchmarking, KPI and performance maturity, and competitive positioning. Companies that cannot produce credible, auditable data on these dimensions face pricing risk, earnout requirements, or failed processes.
The specific metrics sophisticated buyers request during commercial due diligence include:
- Customer acquisition cost by channel, segment, and time period (trend data required, not just current snapshot)
- LTV:CAC ratio by customer segment, with the calculation methodology documented
- CAC payback period, showing whether it has improved or deteriorated over the hold period
- Net revenue retention, demonstrating whether customers expand or contract after acquisition
- Marketing-sourced pipeline as a percentage of total pipeline, proving the existence of scalable demand generation
- Revenue attribution by channel, showing which marketing investments produce revenue and at what cost
- Pipeline coverage ratio, demonstrating the visibility and predictability of future revenue
These are not marketing metrics. They are business health metrics that happen to originate from marketing data. The distinction matters because buyers are evaluating two questions simultaneously: does this company have a proven, scalable way to acquire customers, and does the marketing infrastructure support the revenue growth assumptions in the investment thesis?
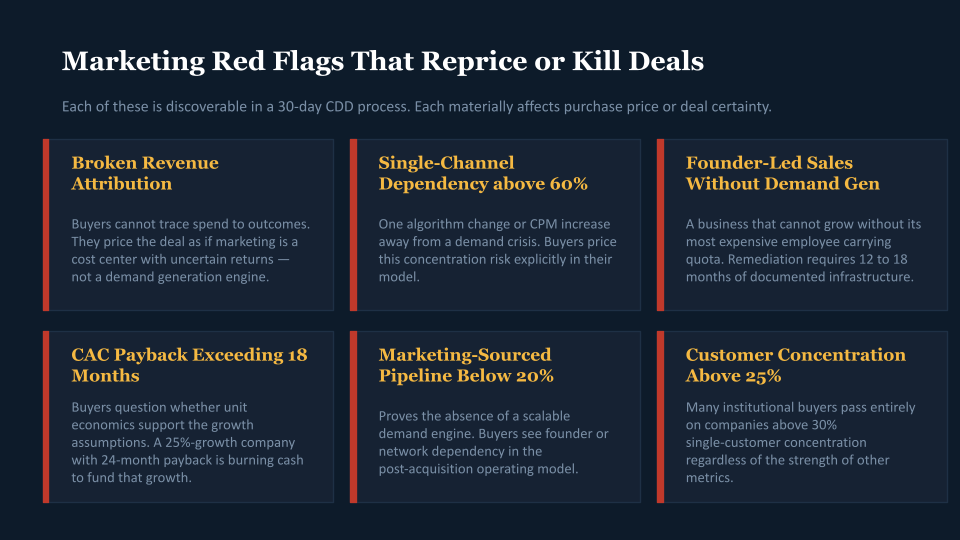
The red flags that kill or reprice deals are well-documented. Bain’s research on exit preparation and practitioner sources consistently identify: revenue concentration above 20% in any single customer, single-channel dependency for more than 60% of revenue, founder-led sales with no documented demand generation playbook, CAC payback exceeding 18 months, and marketing-sourced pipeline below 20% of total. Each of these is discoverable in a 30-day CDD process, and each materially affects purchase price.
The 24-Month Pre-Exit Marketing Value Creation Framework
The 24-month window matters because marketing infrastructure takes time to build, and data takes time to generate. Attribution models require 3 to 6 months to produce reliable trend data. CAC improvements require a full campaign cycle before they can be validated. Buyers want to see 2 to 4 quarters of clean performance data demonstrating an improving trajectory, not a snapshot. This is why exit preparation that begins 6 months before a planned exit almost always fails to capture the available value.
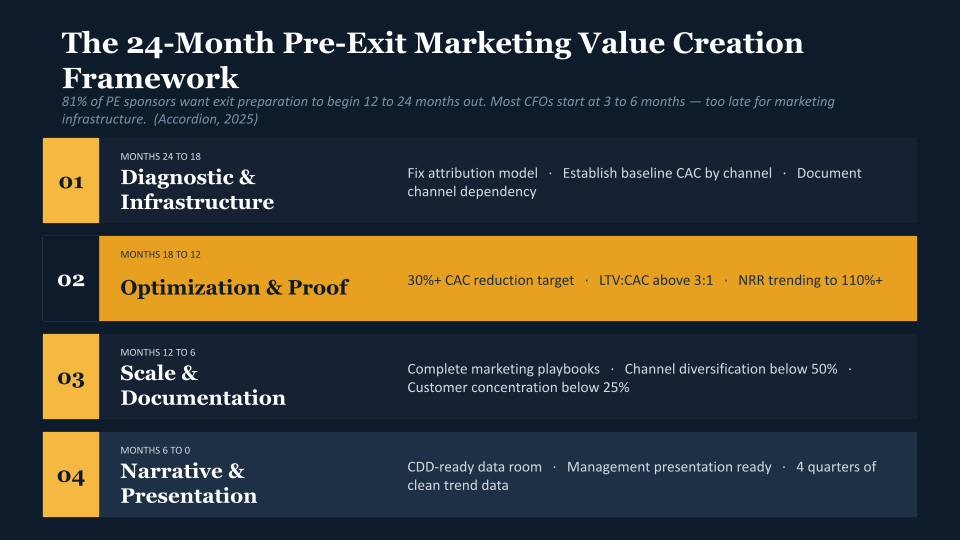
The Accordion 2025 Exit Readiness Survey found that 81% of sponsors want exit preparation to begin 12 to 24 months before exit, yet most portfolio company CFOs begin operational preparation only 3 to 6 months out. The marketing infrastructure work, which is slower to produce clean data and requires longer lead times to demonstrate trends, must begin even earlier.
The framework below sequences the work across four phases. Each phase has specific objectives, metrics to establish, and milestones that feed directly into the exit narrative.
Phase 1: Diagnostic and Infrastructure (Months 24 to 18)
The purpose of the first phase is not to improve performance. It is to establish a baseline and identify which gaps will materially affect valuation if left unaddressed.
The diagnostic work in this phase covers three domains. First, attribution infrastructure: can the company trace a revenue event back to the marketing activity that originated it? For most portfolio companies at $20 million to $100 million in revenue, the answer is no. GA4, CRM, and ad platform data all tell different stories because nobody has connected them into a unified attribution model.
Second, unit economics calculation: does the company have a CAC figure that is calculated consistently, broken down by channel and segment, and agreed upon by marketing and finance?
Research from McKinsey consistently finds that primary value creation in the first 18 to 24 months can lift equity value 20 to 50%. Companies that cannot calculate their CAC cannot demonstrate this improvement credibly.
Third, channel dependency: what percentage of revenue originated from each marketing channel over the past 12 months? Single-channel dependency above 60% is a CDD red flag, regardless of how efficient that channel is, because it represents concentration risk in the demand generation engine.
The milestones for Phase 1 are: attribution model implemented and producing clean data, CAC calculated by channel for at least 6 months of historical data, and channel dependency documented with a diversification plan if concentration is above 60%.
Phase 2: Optimization and Proof (Months 18 to 12)
Phase 2 produces the performance improvement that Phase 1 made possible. With attribution infrastructure in place and baseline unit economics established, the team can now identify which channels produce customers at the lowest cost, which customer segments produce the highest LTV:CAC ratios, and where budget is being allocated to channels that do not produce revenue proportional to their spend.
The CAC improvement target during this phase should be specific and documented. A 30% CAC reduction at a portfolio company spending $5 million annually on marketing generates approximately $1.5 million in annual savings. At a 10x EBITDA multiple, that is $15 million in enterprise value from a budget reallocation exercise.
Customer acquisition costs have increased 222% over the past decade, creating pressure across every portfolio company’s unit economics. Phase 2 is the opportunity to reverse that trend in a documented, verifiable way before a buyer examines the numbers.
LTV:CAC optimization in this phase requires connecting marketing data to customer revenue data. The industry benchmark for a healthy LTV:CAC ratio is 3:1. Companies in the 4:1 to 5:1 range command valuation premiums from buyers who interpret this ratio as evidence of a capital-efficient growth engine. Companies below 2:1 face repricing questions during CDD.
The improvement from 2:1 to 4:1 requires two things: reducing CAC through attribution-driven budget allocation, and identifying customer segments with above-average retention and expansion rates.
An NRR above 100% tells a buyer that existing customers are growing their spend. According to Software Equity Group, a 10-point NRR improvement can drive 20 to 30% higher valuation. This metric is substantially influenced by post-sale marketing and customer success marketing activities that most portfolio companies underinvest in because they are focused on acquisition. Phase 2 is the right time to begin building the expansion revenue infrastructure that NRR measures.
The milestones for Phase 2 are: CAC trending downward for 3 consecutive quarters with documented attribution to specific channel changes, LTV:CAC ratio improving from baseline, NRR measured monthly and trending toward 110% or above, and marketing-sourced pipeline above 25% of total pipeline.
Phase 3: Scale and Documentation (Months 12 to 6)
Phase 3 consolidates the performance improvements from Phase 2 into scalable, documented systems. The objective is to demonstrate that the growth engine does not depend on any individual person and that a new owner could replicate the results.
Documentation for buyer review during CDD typically includes: marketing playbooks covering ICP definition, channel strategy, and campaign execution, attribution model documentation explaining how revenue is connected to marketing activity, historical performance data organized by quarter showing the improvement trajectory, vendor and agency contracts with performance accountability structures, and a budget allocation framework showing the logic behind channel investment decisions.
Channel diversification also reaches its completion in this phase. McKinsey’s research on exit prospects notes that companies with more than 3 active revenue-generating channels command lower risk premiums from buyers, because the demand generation engine is not dependent on any single channel’s continued performance.
Customer concentration risk should also be addressed in this phase. If any single customer represents more than 20% of revenue, the marketing objective is to diversify the pipeline and win new customers in segments that reduce concentration, not to sacrifice the existing customer relationship. Some buyers will pass entirely on companies with above 30% concentration in a single customer, regardless of the strength of other metrics.
The milestones for Phase 3 are: 4 quarters of clean, attributable marketing performance data in a CDD-ready format, marketing playbooks complete and reviewed by an external advisor, channel diversification reducing single-channel dependency to below 50%, and customer concentration below 25% for any single customer.
Phase 4: Narrative and Presentation (Months 6 to 0)
Phase 4 does not create value. It makes visible the value that the prior three phases created. The work in this phase is preparing the marketing section of the management presentation and ensuring that the data room contains the evidence buyers need to validate the growth story.
The marketing section of a PE management presentation covers seven elements: the ICP and market size with segment-level documentation, the demand generation engine with attribution and CAC data by channel, unit economics with LTV:CAC and CAC payback period trends, NRR and expansion revenue data, pipeline coverage and predictability metrics, marketing team structure and documentation, and a forward-looking growth plan that connects current marketing infrastructure to the revenue growth assumptions in the exit financial model.
The forward-looking plan deserves particular attention. EY’s research on maximizing portfolio company exit valuations emphasizes that buyers pay for future revenue, not historical revenue.
The marketing section of the management presentation must demonstrate not just what happened, but what the infrastructure supports going forward. A company with a documented, repeatable demand generation engine that has produced consistent results across multiple quarters commands a meaningfully higher multiple than one that reports the same revenue from an opaque or undocumented process.
The EBITDA Mathematics of Marketing Improvement
The connection between marketing efficiency and enterprise value is direct and calculable. The table below shows the enterprise value impact of specific marketing metric improvements at a portfolio company with $40 million in revenue and an 8x EBITDA multiple.
| Marketing Improvement | Annual EBITDA Impact | Enterprise Value Impact (8x multiple) |
| 30% CAC reduction (5M marketing budget) | +$1.5M in cost savings | +$12M in enterprise value |
| NRR improvement from 100% to 115% | +Revenue multiple expansion | +25 to 40% valuation premium |
| LTV:CAC from 2:1 to 4:1 | Demonstrates growth efficiency | Buyer risk premium reduction |
| Marketing-sourced pipeline: 15% to 40% | Proves scalable demand gen | Deal certainty improvement |
| CAC payback: 24 months to 12 months | Capital efficiency signal | Multiple expansion at comparable revenue |
| Attribution model: last-click to multi-touch | 20 to 30% budget reallocation opportunity | +$2M to $3M EBITDA if savings captured |
The multiplier effect is significant. At a 10x EBITDA multiple, every dollar of marketing cost savings that flows to EBITDA generates ten dollars of enterprise value.
At a 12x multiple, which is achievable for companies with strong unit economics and NRR above 110%, the same dollar generates twelve dollars of enterprise value.
This math is why GP-led operational value creation has become the primary source of differentiated returns. With median EBITDA purchase multiples at 11.8x and financial engineering options more constrained, the companies that document and deliver operational improvements in unit economics are the ones that generate carry.
What Buyers Find During Commercial Due Diligence
Most Operating Partners are surprised by what a rigorous CDD process discovers inside a portfolio company marketing function. The most common findings that affect deal value or deal certainty are:
Broken or missing revenue attribution
When a buyer’s CDD team asks “how much revenue did marketing produce last quarter,” and the answer involves caveats about which systems count and which they do not, the next question is what the real CAC is and what the real marketing contribution to revenue is.
Companies shifting from last-click to multi-touch attribution consistently discover that 20 to 30% of their marketing budget has been misallocated because the attribution model was rewarding the last-touch channel rather than the channels that originated demand. Buyers interpret broken attribution as evidence that the management team does not actually know which parts of the business work.
Single-channel dependency
A company that generates 70% of its revenue from paid search is one algorithm update or CPM increase away from a demand generation crisis.
Buyers price this risk explicitly. The documentation required to address this concern is a 12-month channel diversification plan with specific pipeline contribution targets by channel, implemented and showing early results before the management presentation.
Founder-led sales with no demand gen infrastructure
This is the pattern that most frequently produces failed exits or heavily discounted transactions for companies in the $20 million to $50 million revenue range. The founder is an extraordinary salesperson. Marketing generated some leads. Most pipelines came from the founder’s network and relationships.
A buyer looks at this and sees a business that cannot grow without its most expensive employee continuing to carry a quota. The remedy is 12 to 18 months of documented demand generation infrastructure, not a claims-based assertion that the business can scale.
CAC payback exceeding 18 months
The median CAC payback period for B2B SaaS companies reached 20 months in 2024 according to Benchmarkit research.
Buyers who see CAC payback above 18 months immediately question whether the unit economics support the revenue growth assumptions in the model. A company growing 25% annually with a 24-month CAC payback is burning substantial cash to fund that growth. The pre-exit priority is to reduce CAC payback to 12 months or below and document the improvement trajectory.
How PE Firms Are Applying This in 2026
The most sophisticated PE firms are addressing marketing value creation as a structured workstream within the 100-day value creation plan rather than treating it as a background function. Operating Partners are embedding revenue diagnostics, attribution audits, and unit economics analysis in the first 100 days after acquisition, not waiting for the pre-exit window.
According to the McKinsey Global Private Markets Report, GPs focused on operational value creation achieve 2 to 3 percentage points higher IRR compared to peers. The marketing infrastructure work described in this article is a direct contributor to that operational outperformance.
It is not the only lever, but it is one of the few that can generate meaningful EBITDA improvement within 18 months and produce verifiable, auditable data for a CDD process.
The firms generating the most consistent returns from this approach share a common characteristic: they treat marketing not as a budget line but as a revenue infrastructure investment.
The Bain value creation research repeatedly finds that commercial excellence initiatives, which encompass the sales and marketing improvements described in this framework, deliver an average 27% revenue uplift across portfolio companies. That uplift, compounding over a 5 to 7 year hold period, is the mechanism that generates premium exit multiples.
About Azarian Growth Agency
Azarian Growth Agency works with PE-backed portfolio companies that are preparing for exit and need their marketing infrastructure to produce the metrics sophisticated buyers examine during commercial due diligence.
The 24-month framework described in this article reflects our diagnostic work across multiple PE-backed portfolio companies in financial services, fintech, SaaS, healthcare, and B2B services.
In each case, the initial finding was consistent: the marketing function was producing activity and reporting results in channel-level metrics that bore no documented connection to EBITDA or enterprise value. The attribution infrastructure was broken, the CAC calculation was inconsistent, and the pipeline data did not support the revenue growth assumptions in the exit model.
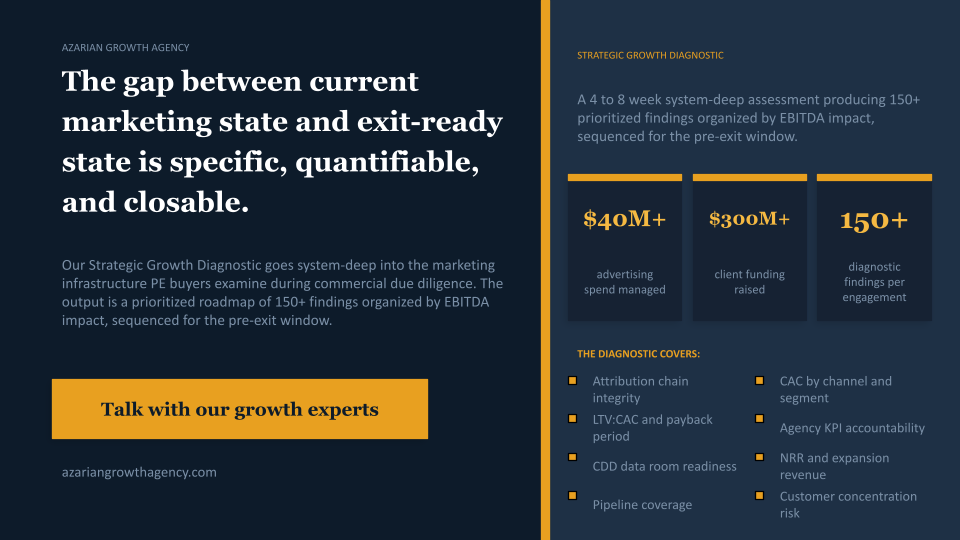
Our Strategic Growth Diagnostic is specifically designed for this situation. It is a 4 to 8-week, system-deep assessment of how a portfolio company’s marketing infrastructure is performing against its exit objectives. We examine attribution chains, unit economics by channel and segment, pipeline coverage, NRR drivers, agency accountability structures, and CRM data integrity. The deliverable is a prioritized roadmap of 150 to 200 findings organized by EBITDA impact, with a clear sequence for addressing each finding within the available pre-exit window.
The diagnosis is not a theoretical analysis. The findings from a typical engagement include specific CAC improvement opportunities with estimated EBITDA impact, attribution infrastructure gaps that are addressable within 90 days, and channel optimization moves that redirect budget from underperforming to high-return sources. Every finding is quantified in EBITDA and enterprise value terms using the exit multiple the Operating Partner is targeting.
We have managed over $40 million in advertising spend, supported companies that have raised over $300 million in funding, and built the diagnostic methodology that connects marketing infrastructure to the metrics PE buyers examine.
Our Fractional CMO engagement, which typically follows the diagnostic, implements the roadmap, and produces the 4 to 6 quarters of clean performance data that supports a premium exit valuation.
If your portfolio company has an exit horizon of 12 to 24 months and the marketing function is reporting in channel metrics rather than EBITDA impact, the gap between the current state and exit-ready state is specific, quantifiable, and closable. The diagnostic is where that work begins.
Talk with our growth experts or learn more about our Strategic Growth Diagnostic to understand what a pre-exit marketing assessment would uncover for your portfolio company.

