
Here is the situation I walk into more often than I should.
A portfolio company has been running paid search, content marketing, LinkedIn campaigns, and organic SEO for 18 months. Revenue is flat. The board is asking questions. The marketing team runs the numbers, and the numbers say: one channel is working, everything else is a money pit.
So they cut everything except paid search. The channel driving “direct revenue.”
Six months later, revenue is still flat. Paid search costs have gone up. Inbound leads have slowed. The team says the market got harder. The operating partner says the marketing team isn’t performing. Everyone is looking at the wrong problem.
The problem is not the marketing team. The problem is not the market. The problem is that the numbers were wrong.
This is one of the most consistent and most expensive patterns I find when running a marketing channel analysis at PE-backed portfolio companies. A channel that looks like it is costing money is actually the one keeping revenue alive. The company kills it. Revenue decays on a 6 to 12 month lag. By the time the connection is made, the channel has been dark long enough that recovery is disproportionately expensive.
| The number you are looking at is not wrong because of a spreadsheet error. It is wrong because of how the credit is being assigned. Change the attribution model, and you often find the channel you killed was the one doing the most work. |
Why Last-Click Attribution Is a Channel Execution Error
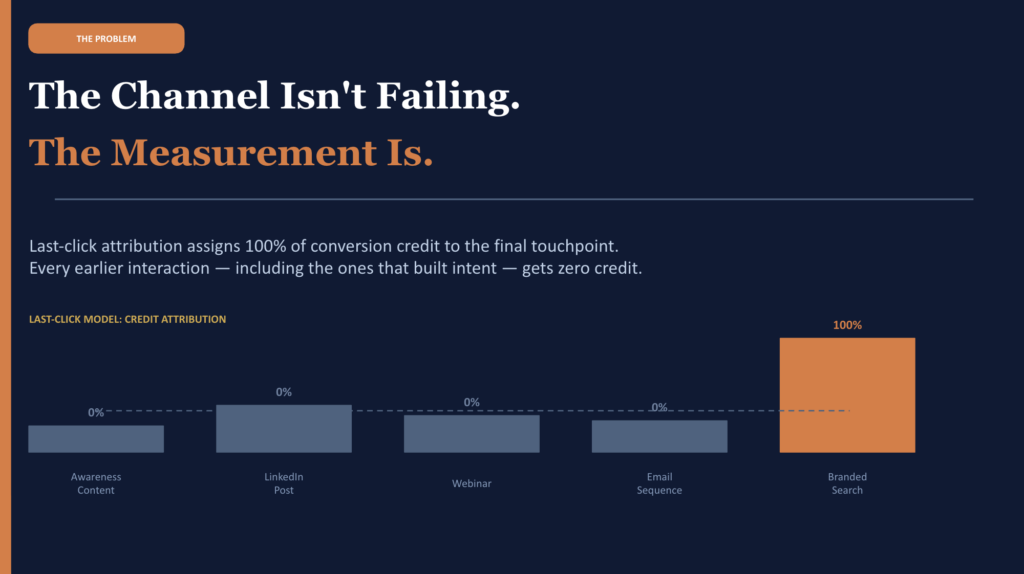
The dominant measurement framework across B2B marketing is still last-click attribution. The platform or touchpoint a prospect interacted with immediately before converting gets 100% of the credit. Every other touchpoint that influenced the decision gets nothing.
This would be a reasonable model if buyers made decisions impulsively after a single interaction. They do not.
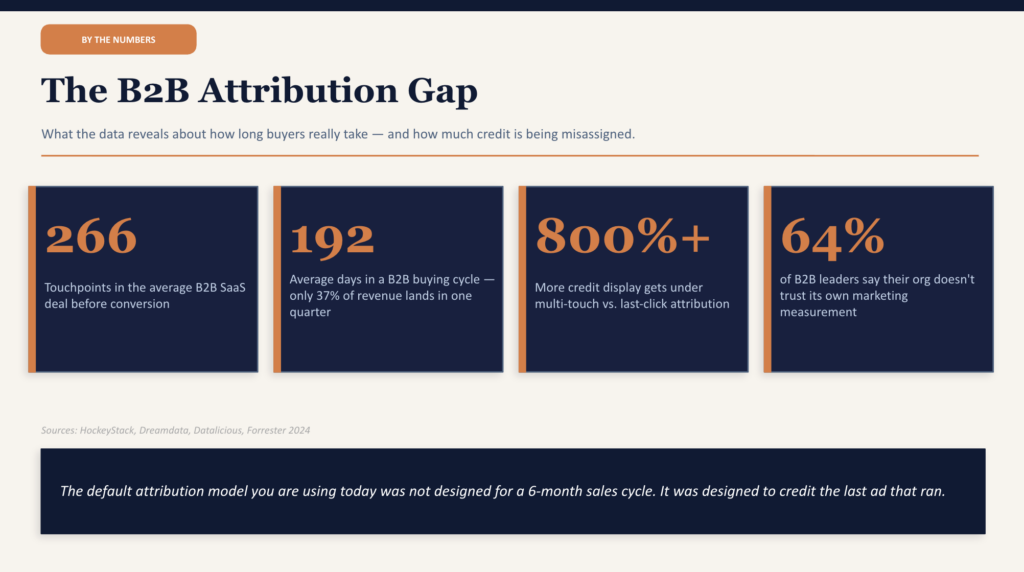
According to HockeyStack’s B2B customer journey research, the average B2B SaaS deal now requires 266 touchpoints and nearly 2,900 impressions before a buyer converts. For deals above $100,000 in annual contract value, that number climbs to 417 touchpoints. Last-click attribution credits one of those 417 interactions and gives the other 416 a value of zero.
Now consider what happens to the channels that generate most of those early touchpoints: LinkedIn organic, content marketing, display, paid social, webinars. None of them close deals directly. They warm the buyer, build familiarity, and create the conditions under which a branded search or a direct visit to the website eventually converts. Under last-click, they all look like they are doing nothing.
This is not a theory. Research by Datalicious found that when companies switched from last-click to multi-touch attribution, the revenue credited to display advertising increased by more than 800%. The money was always there. The model just could not see it.
The Lag Problem That Kills Good Channels
There is a second structural issue sitting underneath attribution: time.
Dreamdata analyzed B2B customer journeys across hundreds of companies and found that the average B2B sales cycle runs 192 days. Only 37% of the revenue impact from marketing materializes within a single quarter. Which means that when a PE operating partner reviews a portfolio company’s marketing ROI at the end of Q1, they are seeing less than half the picture. The other 63% is still in progress.
A company that runs LinkedIn campaigns for 90 days and cuts them because “they are not converting” has made a decision based on a window that is roughly half as long as the average buying cycle. The channel did not fail. The evaluation period was too short.
| What this means for your portfolio: If a portfolio company cut a channel in the past six months based on attribution data, there is a reasonable probability it was cut on incomplete information. That is not a criticism of the team. It is how these systems are built. The default is wrong. |
What the Data Actually Shows About Channel Performance
The pattern repeats at scale. When you look at what happens to companies that cut upper-funnel and brand-building channels, the data is not subtle.
The Ehrenberg-Bass Institute tracked what happens to brands when they go dark on advertising. Their research, replicated across dozens of categories over two decades, found that brands that stopped advertising lost 16% of sales in year one, 25% in year two, and 36% by year three.
More critically, once companies go dark and try to restart, they cannot quickly recover prior momentum. Recovery takes disproportionate time and investment relative to what it would have cost to stay on.
Nielsen documented a related pattern in their Annual Marketing ROI Report. They found that 50% of media plans are underinvested by a median of 50%, and that ROI on those plans could be improved by 50% by simply moving toward the right investment level. The channels most likely to be underinvested: display (underinvested 60% of the time), social (43%), and long-form video. These are, again, the same channels that look worst under last-click.
This is the pattern that operating partners should care about: poor ROI on a channel triggers a budget cut, but the poor ROI was caused by underinvestment in the first place. Cutting accelerates the decline and makes the channel even harder to restore.
The Adidas Case: What Happens When You Listen to the Wrong Model
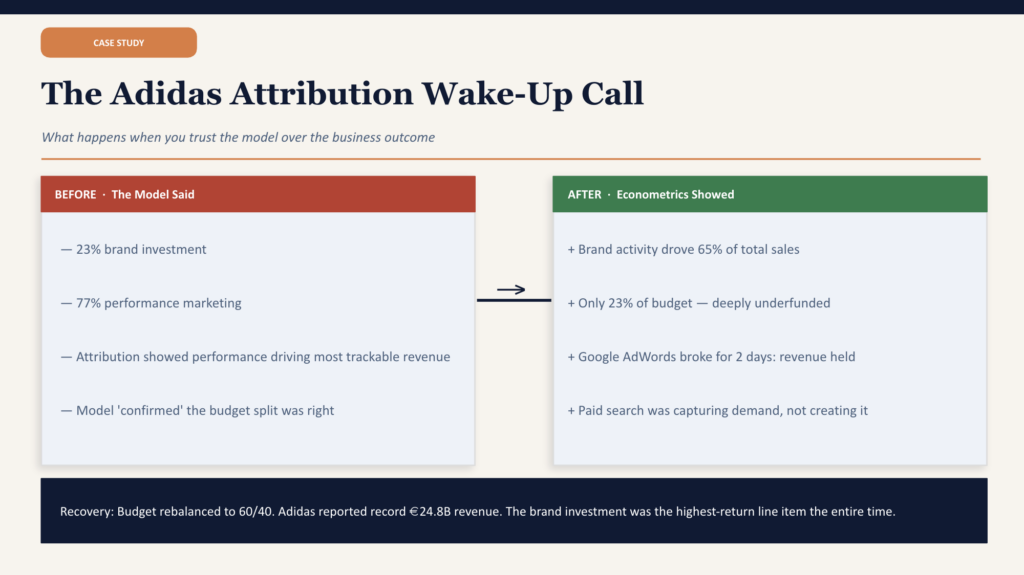
Adidas ran a marketing mix that was approximately 23% brand investment and 77% performance marketing. The decision was driven by their attribution models, which showed performance marketing producing most of the trackable revenue.
When they commissioned an independent econometric analysis, the findings were different. Brand-focused activity was driving 65% of all Adidas sales across all channels, despite receiving only 23% of the budget. They had been systematically starving their highest-return activity for years because the attribution model could not see it.
Simon Peel, Adidas’ Global Media Director at the time, described running a natural experiment when Google AdWords broke for two days: paid search stopped, but traffic and revenue held. The demand that paid search appeared to drive was actually created by brand-building channels and simply captured at the final click.
The lesson is not that performance marketing is bad. It is when performance marketing appears to be producing the most revenue that the data often reflects what is easiest to measure rather than what is doing the most work.
How to Actually Evaluate Marketing Channel Performance
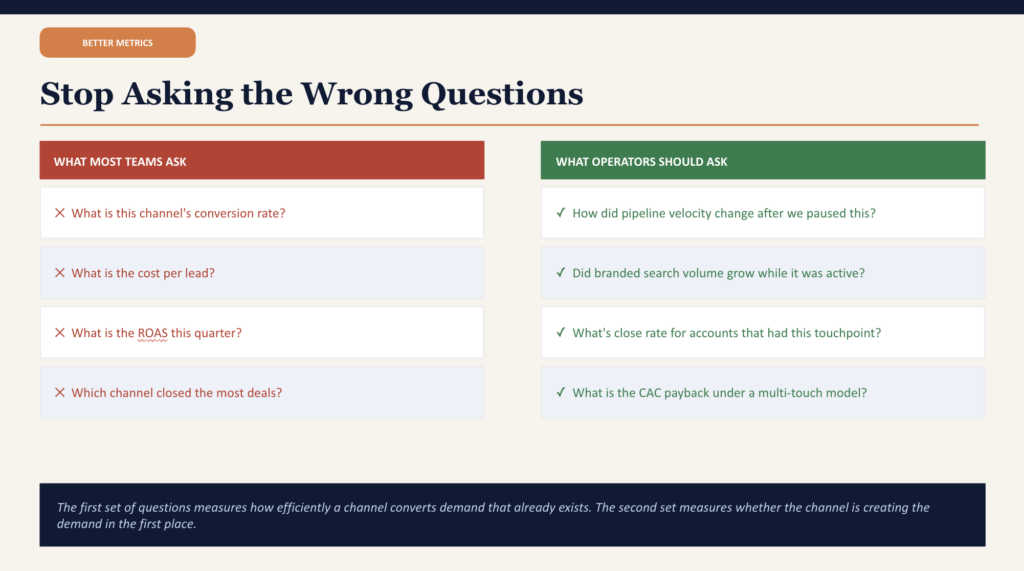
Proper marketing channel performance analysis requires looking at a different set of questions than what most B2B companies are asking. The standard questions are: what is this channel’s conversion rate? What is its cost per lead? What is its ROAS?
These are execution metrics. They tell you how efficiently a channel is converting demand once it exists. They do not tell you whether the channel is building the demand that makes everything else work.
The questions that actually answer the channel performance question are:
- How did pipeline velocity change in the 90 days after we paused this channel?
- Did branded search volume grow while this channel was active?
- What is the close rate on opportunities where this channel appeared in the customer journey, versus opportunities where it did not?
- What is the average deal size for accounts that have multi-channel exposure versus single-channel?
- What is the CAC payback period on customers we can trace back to this channel through a multi-touch model?
The last question is the one that tends to unlock a different conversation with the board. McKinsey’s research on marketing ROI found that combining marketing mix modeling with multi-touch attribution produces efficiency improvements of 15 to 20% in marketing spend and incremental top-line growth of up to 10% without increasing total budget. The gain comes entirely from reallocating away from what looks good on last-click and toward what actually drives revenue.
Measuring Marketing Influenced Pipeline
The single most useful metric for connecting marketing channel performance to business outcomes in a B2B context is the marketing-influenced pipeline. This is not the same as a marketing-sourced pipeline, which only credits marketing for leads it directly generated.
Marketing influenced pipeline asks: for every open opportunity in the CRM, did a contact at that account engage with any marketing activity within a defined window before the opportunity was created? If yes, that opportunity is marketing-influenced.
The formula is straightforward:
| Marketing Influenced Pipeline % = Marketing Influenced Pipeline ($) / Total Pipeline ($) x 100 |
When you run this calculation by channel, you often find that channels with near-zero last-click attribution are influencing 30 to 50% of your best opportunities. That is the number worth bringing to a board meeting, not cost per click.
3 Signals That a Channel You Killed Is Actually Working
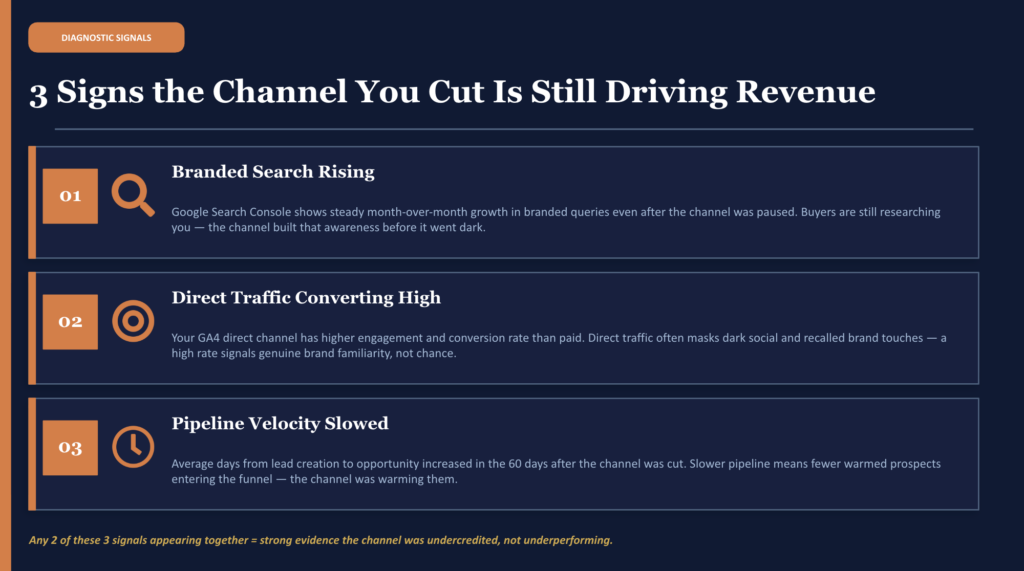
If a channel was cut in the last 6 to 12 months based on performance data, here are the three diagnostic signals that suggest it was working and should be reevaluated.
| Signal | What It Looks Like | Why It Matters |
| Branded search rising | Google Search Console shows steady month-over-month growth in branded queries | Buyers are researching you before they appear in any CRM. The channel built this awareness. |
| Direct traffic converting above average | GA4 direct channel has a higher engagement and conversion rate than paid | Direct often masks dark social and recalled brand touches. High conversion = genuine familiarity. |
| Pipeline velocity slowed after the cut | Average days from lead to opportunity increased in the 60 days following the channel pause | Slower-moving pipeline suggests fewer warmed prospects entering the funnel. |
There is a fourth signal that does not fit neatly in a table: the self-reported attribution gap. Research by Refine Labs found that when companies ask their customers how they first heard about the business, the answers rarely match what the software reports. Software attribution credits branded search and direct traffic for 78% of conversions. Self-reported attribution shows that 85% of closed revenue came from channels like LinkedIn, podcasts, word of mouth, and community, all of which appear as “direct” in GA4 because they do not pass referral data.
If your portfolio company’s customers are regularly saying they found the company through a channel that shows minimal attribution credit in the software, that is your answer. The software is wrong.
What This Looks Like in Practice: A Diagnostic Finding
During a Strategic Growth Diagnostic at a PE-backed financial services company, we found the following situation. The company had been running Google Ads, LinkedIn campaigns, and an SEO content program. Based on last-click data, Google Ads appeared to be driving roughly 80% of conversions. LinkedIn and SEO appeared to be producing almost nothing. Both had been recently de-prioritized, with budgets cut substantially.
When we rebuilt the attribution model using a position-based approach and extended the lookback window to reflect actual sales cycle length, the picture changed completely.
- LinkedIn was present as a first or second touchpoint in more than 60% of the closed-won accounts from the prior 12 months.
- SEO content was the first interaction for approximately one-third of the highest-value customer segment, the same segment the company was most aggressively trying to grow.
- Google-branded search, which appeared to be driving most conversions, was capturing demand that LinkedIn and SEO had already created. Taking it away would not have reduced demand. It would have redirected those buyers to a competitor’s branded search ad.
The channels were not failing. The measurement was failing.
The fix involved reactivating both channels at appropriate budget levels, adjusting the attribution reporting in the CRM to reflect actual cycle length, and building a single marketing-influenced pipeline report that the CFO and CEO could read without a glossary.
Within two quarters, pipeline velocity was back to prior levels. CAC on the high-value segment came down meaningfully as the channel mix returned to a configuration that was doing the work across the full buyer journey.
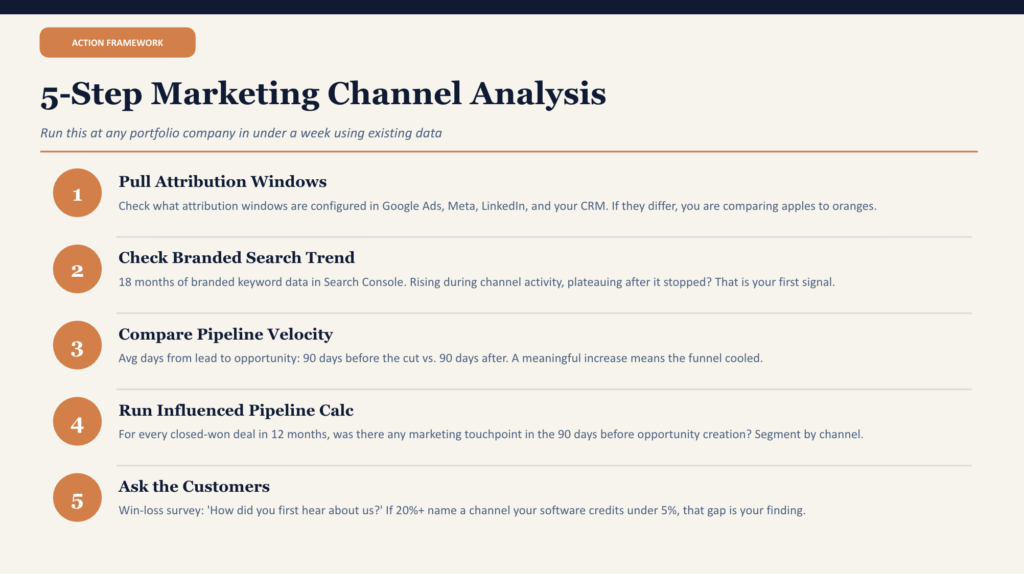
How to Run a Basic Marketing Channel Analysis at Your Portfolio Company
You do not need a dedicated analytics team to get a directional read on whether your channel mix is being evaluated correctly. Here is a practical starting framework.
Step 1: Pull the attribution window data
Ask the marketing team what attribution windows are currently configured in Google Ads, Meta, LinkedIn, and HubSpot or Salesforce. If the windows differ across platforms, you are comparing apples to oranges in every channel performance review. A standard starting point for B2B is a 30-day click, 7-day view window, applied consistently.
Step 2: Check your branded search trend
Pull 18 months of branded keyword data from Google Search Console. If branded search volume grew during a period when a specific channel was active and then plateaued or declined after it was cut, that is a correlation worth investigating. Branded search is one of the most reliable proxies for whether awareness channels are doing their job.
Step 3: Compare pipeline velocity by period
Pull average days from lead creation to opportunity creation for the 90 days before a channel was cut versus the 90 days after. A meaningful increase in that number suggests the top of the funnel cooled down. This is almost never caused by the channel that was not cut.
Step 4: Run a marketing-influenced pipeline calculation
For every closed-won deal in the last 12 months, check whether the buying company had any marketing touchpoints recorded in the CRM within 90 days before opportunity creation. Segment by channel. The channel with the highest influence percentage is almost never the one getting the most last-click credit.
Step 5: Ask the customers
A simple win-loss survey asking “How did you first hear about us?” and “What influenced your decision to reach out?” tends to surface things that attribution software never captures. If more than 20% of respondents name a channel that your software attributes less than 5% of revenue to, that gap is the finding.
Resources
| Resource | Source | Why It Is Useful |
| B2B Marketing Time Lag Analysis | Dreamdata | Shows exactly how long it takes B2B marketing to produce revenue, with data by channel |
| Nielsen Annual Marketing ROI Report (2022) | Nielsen | Documents the 50-50-50 gap and channel-level underinvestment patterns |
| Performance Branding and Marketing ROI | McKinsey | Framework for combining MMM and MTA to stop budget misallocation |
| State of Attribution Report | HockeyStack | Real data on how first-touch and last-touch attributes revenue differently across B2B SaaS |
| The 95-5 Rule: Why B2B Growth Starts Long Before the Purchase | Ehrenberg-Bass Institute | Research on why only 5% of B2B buyers are in-market at any given time |
| Partner Attribution Is Broken | Forrester | Executive-level argument for why B2B attribution must be rebuilt |
| Gartner CMO Survey: Clarify Marketing Impact | Gartner | Best practice framework for using attribution models and marketing mix modeling together |
About Azarian Growth Agency
Azarian Growth Agency is a full-funnel, AI-native growth marketing agency. Since 2020, we have helped PE-backed portfolio companies, VC-backed SaaS businesses, and mid-market enterprises figure out why their marketing is not scaling and then fix it.
We work with operating partners and portfolio company executives who are dealing with exactly what this article describes: real marketing spend, existing channel activity, and attribution data that is not telling the full story. We have seen this pattern at companies across financial services, fintech, healthcare, insurance, and B2B SaaS. It looks slightly different each time. The root cause is almost always the same.
Our Strategic Growth Diagnostic is a paid, independent assessment designed for exactly this situation. We go system-deep: attribution configuration, CRM lead flows, unit economics by channel and segment, agency accountability, and tech stack integrity. We deliver a prioritized findings report that your CFO and board can read without a marketing dictionary. We do not do free audits. We charge because independence costs money and because our findings are designed to be acted on, not filed.
Most diagnostics surface at least one situation that pays for itself in the first 30 days. Sometimes it is a channel that was cut on bad data. Sometimes, the budget is going to segments with deeply negative unit economics. Sometimes it is both.
| Ready to find what your attribution data is missing? Talk with our growth experts at Azarian Growth Agency. We will tell you honestly whether there is a fit and what a diagnostic would cover. If there is not a fit, we will tell you that too. Get in touch |

